 CHARTAISCAN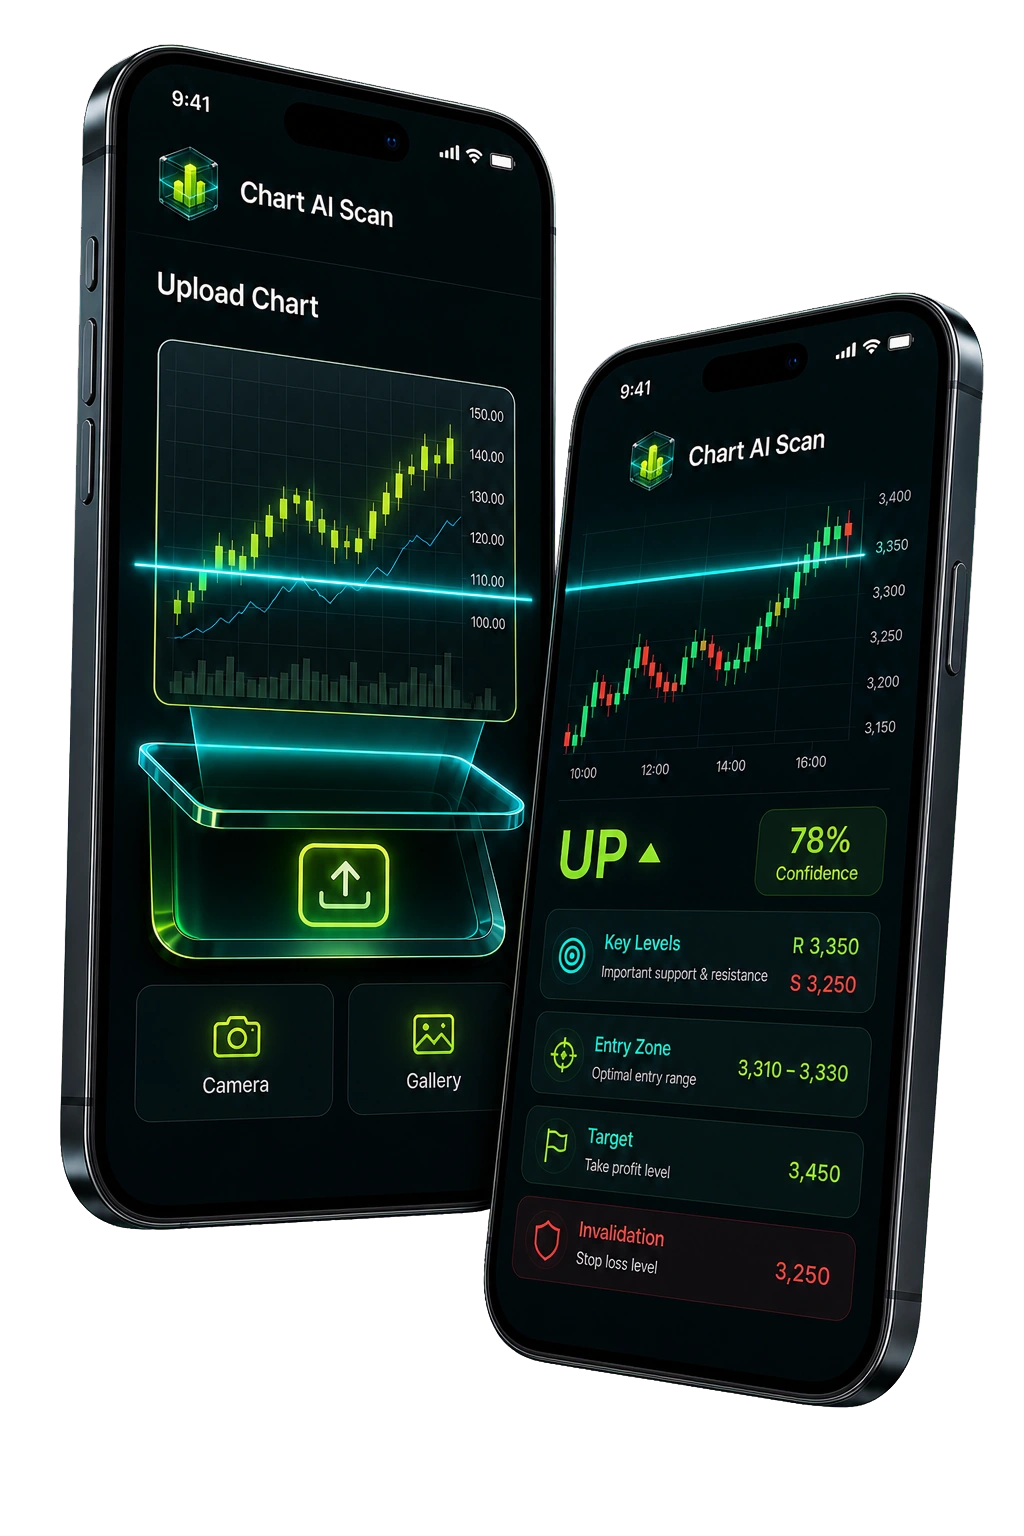
A stock scanner that reads the charts.
Traditional stock scanners filter by fundamentals — P/E ratio, market cap, dividend yield, volume. ChartAIScan's AI stock scanner does something fundamentally different: it reads the chart itself. Upload any stock chart and the AI detects patterns, draws trendlines, marks support and resistance, and identifies candlestick formations. You get technical analysis — not just another list of stocks sorted by P/E. For traders who make decisions based on what the chart is actually showing, this is the scanner that delivers.
Scan stocks across NYSE, NASDAQ, and LSE.
ChartAIScan's AI stock scanner covers the world's major exchanges. Scan NYSE blue chips like JPM, KO, and XOM. Scan NASDAQ tech giants like AAPL, MSFT, and NVDA. Scan LSE listings like HSBA, BP, and GSK. The AI reads price action universally — it doesn't matter which exchange the stock trades on. Upload any stock chart and get the same accurate pattern detection, trendline analysis, and level mapping in seconds.
How AI stock scanning saves you hours.
The math is simple: manually analyzing one stock chart takes 15-45 minutes if you're drawing trendlines, marking levels, and checking for patterns. A watchlist of 20 stocks means 5-15 hours of analysis before you've even found a setup. ChartAIScan's AI stock scanner cuts that to minutes. Upload your chart, get instant AI analysis with all patterns and levels marked, and move to the next. Scan your entire watchlist during a morning coffee — not over an entire weekend. The AI never gets tired, never misses a pattern, and works at a speed no human analyst can match.
Chart-based scanning vs fundamental screening.
Fundamental screeners tell you what a company is worth — but they don't tell you when to buy or sell. ChartAIScan's AI stock scanner fills that gap. It detects the technical patterns that highlight entry and exit timing: breakout flags on trending stocks, double bottoms at support, head and shoulders at resistance, triangle compressions before moves. Use fundamental screeners to build your watchlist, then use ChartAIScan to find the actual trade setups. The two approaches are complementary — and ChartAIScan is the technical layer most stock screeners lack.
Stock scanner questions answered.
What is an AI stock scanner?
An AI stock scanner uses artificial intelligence to analyze stock charts automatically. ChartAIScan detects chart patterns, draws trendlines, marks support/resistance levels, and identifies candlestick formations — all from an uploaded chart screenshot. It's technical analysis powered by AI, not a fundamental screening tool.
Which stock exchanges does the scanner support?
ChartAIScan's AI stock scanner works with stocks from NYSE, NASDAQ, and LSE — essentially any stock chart you can screenshot. The AI reads price action, not exchange data, so charts from any exchange get the same accurate pattern detection.
How is this different from a stock screener?
Stock screeners filter by fundamentals — P/E, market cap, volume, sector. ChartAIScan's AI stock scanner analyzes the chart itself — detecting patterns, trendlines, and levels. Screeners tell you what to look at; ChartAIScan tells you what the chart is actually showing. Many traders use both: screeners to build watchlists, ChartAIScan to find entries.
Can I scan multiple stocks at once?
Yes. ChartAIScan's batch scanning feature (premium) lets you upload and scan multiple stock charts simultaneously. Results are ranked by pattern confidence so you can prioritize the strongest setups. Free tier users can scan stocks one at a time with full AI analysis.
Is the AI stock scanner free?
ChartAIScan offers a free tier with full AI stock scanning — pattern detection, trendline analysis, and support/resistance levels for any stock chart. No credit card required. Premium features unlock higher daily scan limits and batch scanning for larger watchlists.