 CHARTAISCAN
 AI chart analysis
for stocks, forex & crypto.
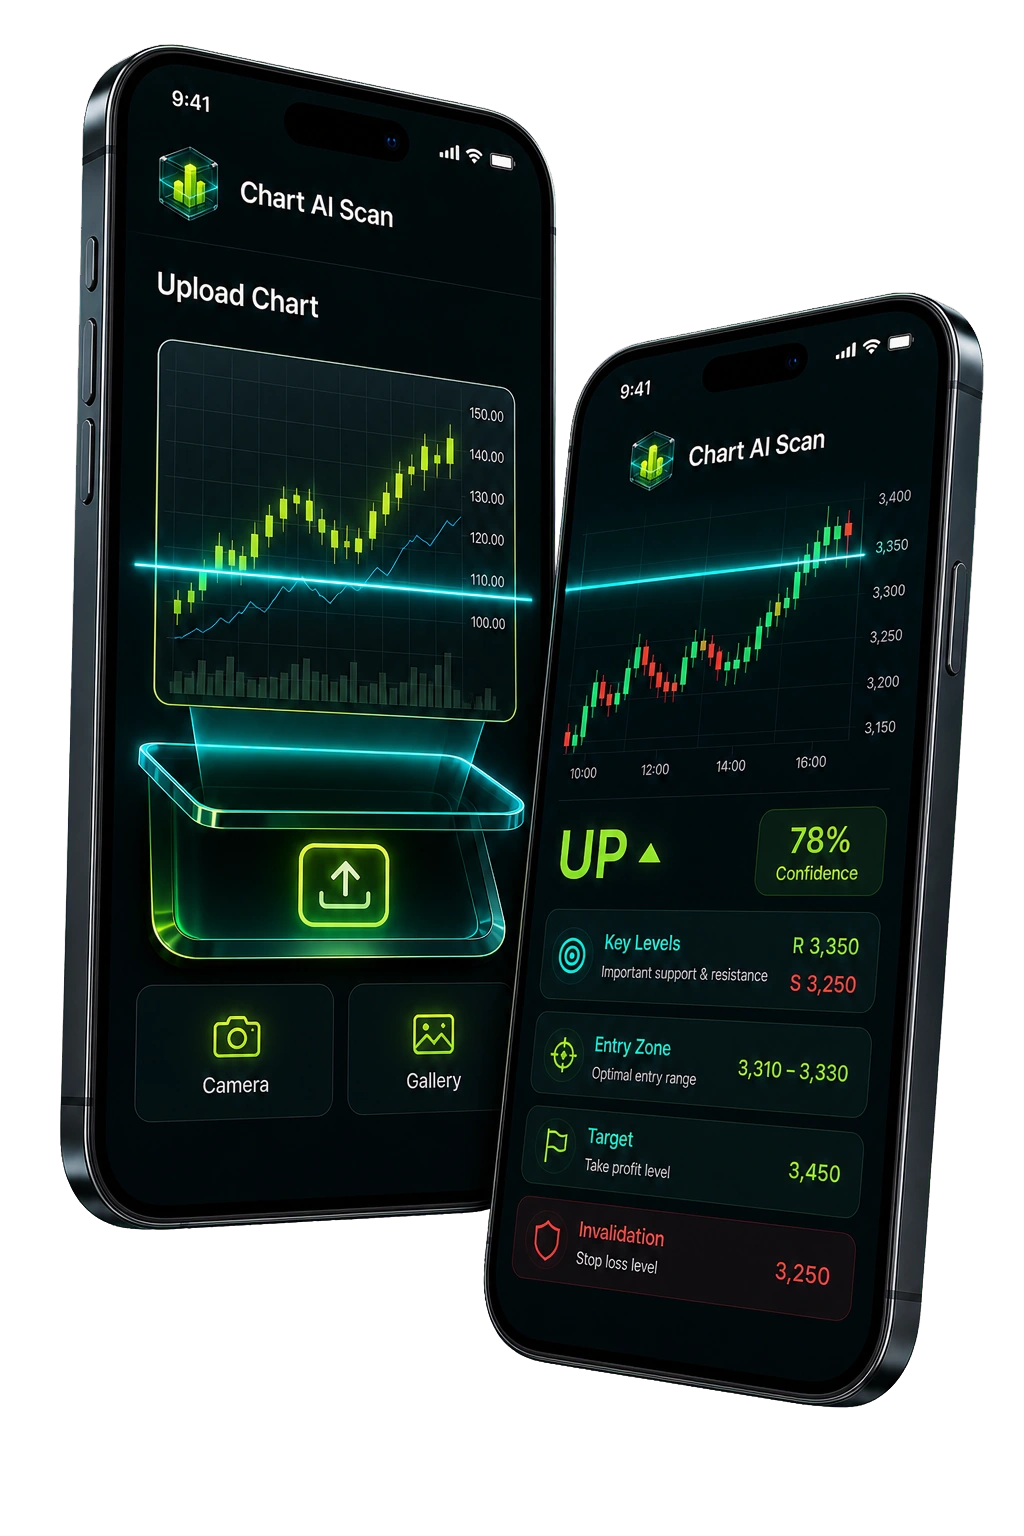
Upload any chart and ChartAIScan instantly detects patterns, trendlines, support/resistance, and candlestick formations. Get clear entry and exit levels — no manual drawing required.
A feed you can verify.
Every signal we publish is timestamped and price-stamped. Scroll the last few — the same feed you see the second you sign in.
Three steps to AI-powered chart analysis.
Our AI scans and analyses every chart you upload. No manual drawing, no missed patterns, no guesswork.
Upload or select a chart
Drag in any stock, forex, or crypto chart. ChartAIScan works with screenshots, TradingView charts, and broker platforms.
AI scans and detects patterns
Our AI engine instantly scans your chart — detecting trendlines, support/resistance, candlestick patterns, and chart formations.
Get actionable analysis
Receive clear entry, stop-loss, and target levels. Export to your trading platform or share with your team in seconds.
Every alert includes the full trade plan.
Not a vague "buy signal" tip. A complete, broker-ready setup with risk pre-defined — so you know exactly what you stand to lose before you click.
- Exact entry price (or range)
- Pre-calculated stop-loss
- Three take-profit targets (TP1 / TP2 / TP3)
- Suggested lot size for your account
- Live management — we tell you when to move SL or close
Add a second edge to your trading.
If you're already trading profitably, ChartAIScan isn't a replacement — it's a second opinion. Compare our analyst calls against your own setups. Many experienced traders use us to confirm bias or catch setups they'd otherwise miss during off-hours.
- → Use as confirmation for your own analysis
- → Catch setups during sessions you can't watch
- → 93% win rate across 1000+ verified trades
- → No lock-in — view results before subscribing
See what last quarter would have returned.
Drag the slider. Based on our Q1 2026 verified track record of +1,847 pips across 138 signals at 87.4% win rate. Past performance is not future returns — but it's a starting point.
Trusted by 17,000+ members.
From first-time traders to seven-figure prop firm operators — here's why they stay.
What we don't do.
Most signal services lie by omission. Here's exactly what ChartAIScan is not.
We don't promise 100% wins.
Anyone who does is selling you a fantasy. We aim for 80%+ — over 7 years we've held that. Losses are baked into the system.
We don't trade your account.
You stay in control. We send the alert, you decide whether to take the trade. Your money never touches us.
We don't push leverage.
Every signal sizes for 1% risk per trade. If your broker offers 1:500 leverage, that's between you and them.
We don't lock you in.
Cancel any time, one click, no calls. 60 days after that, ask for a refund if you didn't make your money back.
See the numbers before you trade.
Our performance dashboard shows rolling 30-day win rate, average pips per trade, drawdown, and monthly return — updated after every closed signal. No locked metrics.
- → 30-day rolling win rate (currently 93%)
- → Average pips per signal: 91.7
- → Trades per month: 46
- → Average trade duration: 3h 25m
AI chart analysis questions, answered.
What is ChartAIScan? +
ChartAIScan is an AI-powered chart analysis platform that scans stock, forex, and crypto charts to detect patterns, draw trendlines, and identify support/resistance levels. Upload any chart and the AI delivers an instant technical analysis — no manual drawing required.
How does AI chart analysis work? +
ChartAIScan uses machine learning models trained on millions of real market charts across stocks, forex, and crypto. The AI recognises patterns (double tops, head and shoulders, flags, triangles), maps trendlines, identifies key support/resistance levels, and assigns a confidence score to every detection. You get a complete technical breakdown of your chart in seconds.
What markets and instruments does ChartAIScan cover? +
ChartAIScan analyses stocks (NYSE, NASDAQ, LSE), forex pairs (major, minor, and exotics), cryptocurrencies (BTC, ETH, top 100 altcoins), indices, and commodities. The AI is trained on multi-asset data — it detects patterns consistently regardless of what you trade.
How accurate is the AI pattern detection? +
ChartAIScan's AI is trained on millions of verified chart patterns across multiple asset classes — stocks, forex, and crypto. Every detection includes a confidence score (0-100%) so you can filter by your risk tolerance. Results are transparent: you see exactly what the AI sees with annotated charts, not a black-box output.
Is ChartAIScan free? +
Yes — ChartAIScan has a free tier that gives you core AI chart analysis. Upload charts, get pattern detection, trendlines, and support/resistance levels. Premium features (real-time scanning, multi-timeframe analysis, advanced filters) are available on paid plans. No credit card required to start.
What does the AI output include? +
Every AI scan outputs: detected chart patterns with confidence scores, automated trendlines, key support and resistance levels, momentum indicators, and AI-generated commentary explaining what the analysis means. All results are overlaid on your original chart so you can visually verify every finding.
Can I use ChartAIScan for day trading? +
ChartAIScan analyses charts on any timeframe — from 1-minute candles for scalpers and day traders to daily and weekly charts for swing traders and long-term investors. The AI adapts its pattern recognition to your chosen timeframe and detects patterns appropriate for that speed of trading.
How is ChartAIScan different from other chart scanners? +
Three things: (1) Multi-asset AI training — our models learn from stocks, forex, and crypto simultaneously, giving broader pattern recognition than stock-only competitors. (2) Confidence scoring — every detection is rated, not just flagged. (3) Visual confirmation — you see annotated charts, not just text alerts. Compare us to TrendSpider or Trade Ideas on our comparison pages.
Start scanning charts smarter.
Join thousands of traders who use ChartAIScan for AI-powered chart analysis and pattern detection. Free to try. No experience required.