 CHARTAISCAN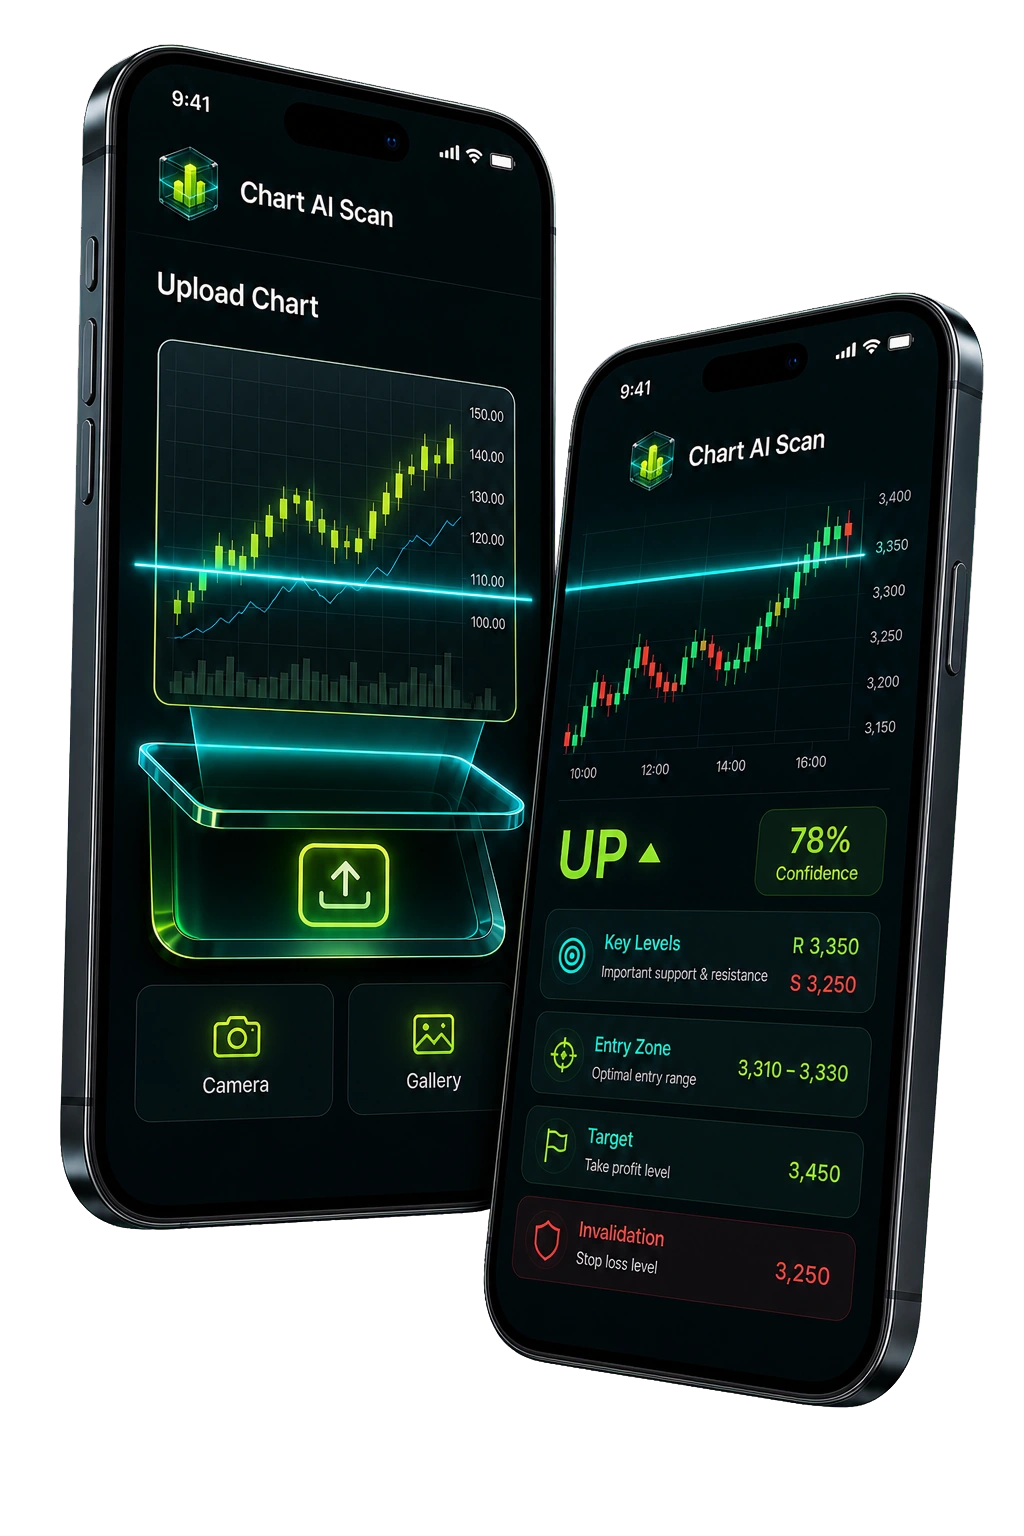
Why standard indicators need AI enhancement
Every market moves differently. Stocks have earnings gaps. Forex pairs react to economic data. Crypto has 24/7 volatility. A one-size-fits-all indicator setting that works on EUR/USD can fail completely on TSLA or BTC. The difference isn't subtle — it's structural.
RSI overbought at 70 and oversold at 30 is the classic example. A strong trending instrument can stay overbought for days, so a basic RSI signal often tells traders to fade the exact move they should be following. MACD default 12/26/9 is usually too slow for volatile intraday moves. Bollinger Bands at 2 standard deviations are often too tight for crypto but too wide for stable stocks.
The fix is not adding more indicators. The fix is AI-powered analysis that reads each chart individually — detecting patterns, mapping trendlines, and identifying support/resistance based on the specific instrument and market context in your chart.
ChartAIScan's four-layer AI analysis
ChartAIScan uses a four-layer AI approach instead of a single indicator trigger. One condition can be fooled by market noise. Four independent AI detection layers make the analysis more robust and keep the focus on high-quality technical structures.
Trend detection
AI identifies trendlines, channels, and directional bias from the chart structure. Detects both major and minor trend levels automatically.
Pattern recognition
AI scans for chart formations — triangles, flags, head and shoulders, double tops/bottoms, wedges, and candlestick patterns like doji, engulfing, and hammer.
Support/resistance
AI maps key horizontal and diagonal support/resistance zones based on price interaction history, volume clusters, and structural pivots.
Volatility context
AI assesses the volatility environment — identifying whether the chart shows consolidation, expansion, or momentum conditions to contextualize pattern signals.
When all four layers produce aligned signals, ChartAIScan annotates the chart with key levels, pattern labels, trendlines, and directional bias. The analysis is not a black box: trend structure, pattern recognition, support/resistance mapping, and volatility context must all agree before the AI marks a high-confidence setup.
AI analysis vs manual indicators
Manual indicators apply the same formula to every chart. AI reads each chart individually. This comparison shows why AI-powered analysis produces more reliable and context-aware results across different instruments and market conditions.
| Metric | ChartAIScan AI | Manual RSI crossover | Manual MACD |
|---|---|---|---|
| Detection rate | High | Moderate | Low |
| False positives | Low | High | Very high |
| Multi-pattern | Yes | No | No |
| Session-aware | Yes | No | No |
| Instruments | Stocks, Forex, Crypto | Single market | Single market |
What ChartAIScan's AI detects automatically
Instead of manually drawing trendlines, marking levels, and scanning for patterns — let AI do it in seconds. Here's what ChartAIScan's detection engine identifies on every chart you upload.
| Analysis Type | What it detects | Manual approach | AI approach | Best used for |
|---|---|---|---|---|
| Trendlines | Trend direction | Manual drawing | AI auto-detected | Instant trend structure mapping |
| Support/Resistance | Key price zones | Manual identification | AI-mapped with confidence | Faster level identification |
| Candlestick Patterns | Price action signals | Visual recognition | AI pattern matching | Covers all major formations |
| Chart Formations | Technical structure | Subjective identification | AI object detection | Consistent across all charts |
| Momentum Structure | Trend strength | Indicator-based | AI multi-factor analysis | Context-aware momentum reading |
The point is not to replace your analysis. The point is to accelerate it. AI detects what would take you 20-30 minutes of manual chart work in seconds. Faster trendline mapping means more time evaluating setups. Consistent pattern recognition means fewer missed formations. AI-augmented support/resistance means more reliable level identification across all your charts.
How to use ChartAIScan
ChartAIScan works with charts from any platform. Upload a screenshot, get AI analysis. No complex installation — the AI reads chart images visually.
Web Platform
Visit chartaiscan.com from any browser.
Create a free account (email + password).
Upload a chart screenshot from any platform.
Receive instant AI analysis with annotations.
TradingView
Open your chart on TradingView.
Take a screenshot of the full chart.
Upload to ChartAIScan (drag & drop).
Get AI-detected patterns and levels overlaid.
MT4 / MT5
Open your chart on MT4 or MT5.
Screenshot or export the chart image.
Upload to ChartAIScan via browser.
Review AI analysis alongside your platform.
Platform comparison
ChartAIScan is the fastest way to screen charts with AI. TradingView remains the best environment for manual charting and deep-dive analysis. MT4/MT5 are excellent for broker execution and automated trading. Each platform serves a purpose — ChartAIScan accelerates the analysis step.
| Platform | Analysis method | Main strength | Backtesting | Execution | Best for |
|---|---|---|---|---|---|
| ChartAIScan Web | AI visual analysis | Instant pattern detection | N/A (AI-based) | Manual execution | Rapid chart screening and pattern identification |
| TradingView | Pine Script indicators | Best visualization | Strong visual testing | Chart-based execution | Charting, manual analysis, and signal visualization |
| MT4/MT5 | MQL4/MQL5 | Broker execution | Strategy Tester | Manual + EA trading | Fast execution, familiar workflows, and broker integration |
Frequently asked questions
What are the best technical indicators for AI-enhanced chart analysis? +
The best indicators for AI-powered analysis are RSI, MACD, EMAs, Bollinger Bands, and ATR — calibrated for the specific instrument and timeframe you're analyzing. Standard settings often fail because they're one-size-fits-all. ChartAIScan's AI engine optimizes indicator parameters for each chart you upload, detecting patterns and levels automatically.
Why do standard RSI settings fail across different markets? +
Standard RSI uses 70/30 as overbought and oversold. High-volatility instruments can stay above 70 or below 30 for extended periods during strong trends, so those levels often trigger early exits or counter-trend entries. ChartAIScan's AI adapts thresholds based on the specific instrument and market conditions in your chart.
What makes ChartAIScan's AI analysis different from manual indicators? +
Manual indicators apply generic formulas to every market identically. ChartAIScan's AI analyzes each chart individually — detecting patterns, optimizing indicator parameters for the specific instrument, and considering session timing and volatility context. The AI identifies what a human analyst would look for, but in seconds instead of hours.
How does ChartAIScan generate entry and exit levels? +
ChartAIScan's AI analyzes multiple layers simultaneously: trend direction and strength, momentum conditions, support/resistance levels, candlestick patterns, and volatility structure. When these factors align, the AI annotates the chart with key entry zones, support/resistance levels, and directional bias.
How often should I scan charts with ChartAIScan? +
The AI is designed for on-demand analysis — scan whenever you're evaluating a new setup. Many traders scan at the start of each session, after major news events, or when price approaches key levels. The AI processes each chart in seconds, so you can scan as frequently as you need without waiting.
How do I use AI indicators on TradingView? +
ChartAIScan works with screenshots from any platform including TradingView. Capture your chart, upload it to ChartAIScan, and receive AI analysis with annotated patterns, trendlines, and levels directly in your browser. No Pine Script installation required — the AI reads the chart visually, just like a human analyst.
Can I use ChartAIScan analysis on MT4 or MT5? +
Yes. ChartAIScan works with screenshots from any platform including MetaTrader 4 and 5. Simply screenshot your chart on MT4/MT5, upload it to ChartAIScan, and get instant AI analysis. The AI reads chart images regardless of the source platform — no plugin or indicator installation required.
Does ChartAIScan's AI analysis repaint or change? +
ChartAIScan's AI analysis is based on the chart snapshot you upload. The detected patterns, trendlines, and levels represent what the AI identifies at that moment. Unlike live indicators that can shift with each new candle, the analysis is a fixed reading of the chart conditions at the time of upload. For evolving setups, simply upload an updated screenshot.
What timeframe works best for AI chart analysis? +
ChartAIScan works with any timeframe — from 1-minute scalping charts to monthly trend analysis. The AI adapts its detection to the chart's granularity. Higher timeframes (H1, H4, Daily) generally produce more reliable pattern detection with less noise. Lower timeframes work well for entry timing once the broader structure is confirmed on higher timeframes.
Does ChartAIScan work on mobile? +
Yes. ChartAIScan is web-first and fully responsive — it works on any mobile browser (iOS Safari, Android Chrome). Upload chart screenshots directly from your phone's photo library or take a screenshot within your trading app. The analyzed chart with annotations displays responsively on all screen sizes.
Can I combine ChartAIScan AI analysis with my own indicators? +
Absolutely. ChartAIScan is designed to augment — not replace — your existing analysis workflow. Use the AI to quickly identify patterns, trendlines, and key levels, then apply your own indicators and judgment to confirm or filter the AI's findings. The AI accelerates the initial analysis; your experience and strategy make the final trading decision.
How does ChartAIScan improve over time? +
ChartAIScan's AI detection engine is continuously trained on new chart data across stocks, forex, and crypto. Pattern recognition accuracy improves as the model learns from millions of verified chart formations. You're always using the latest AI model — no manual updates or indicator installations required.
Continue reading
Get AI-powered chart analysis.
Free tier available. Upload any chart for instant pattern detection and level mapping.