 CHARTAISCAN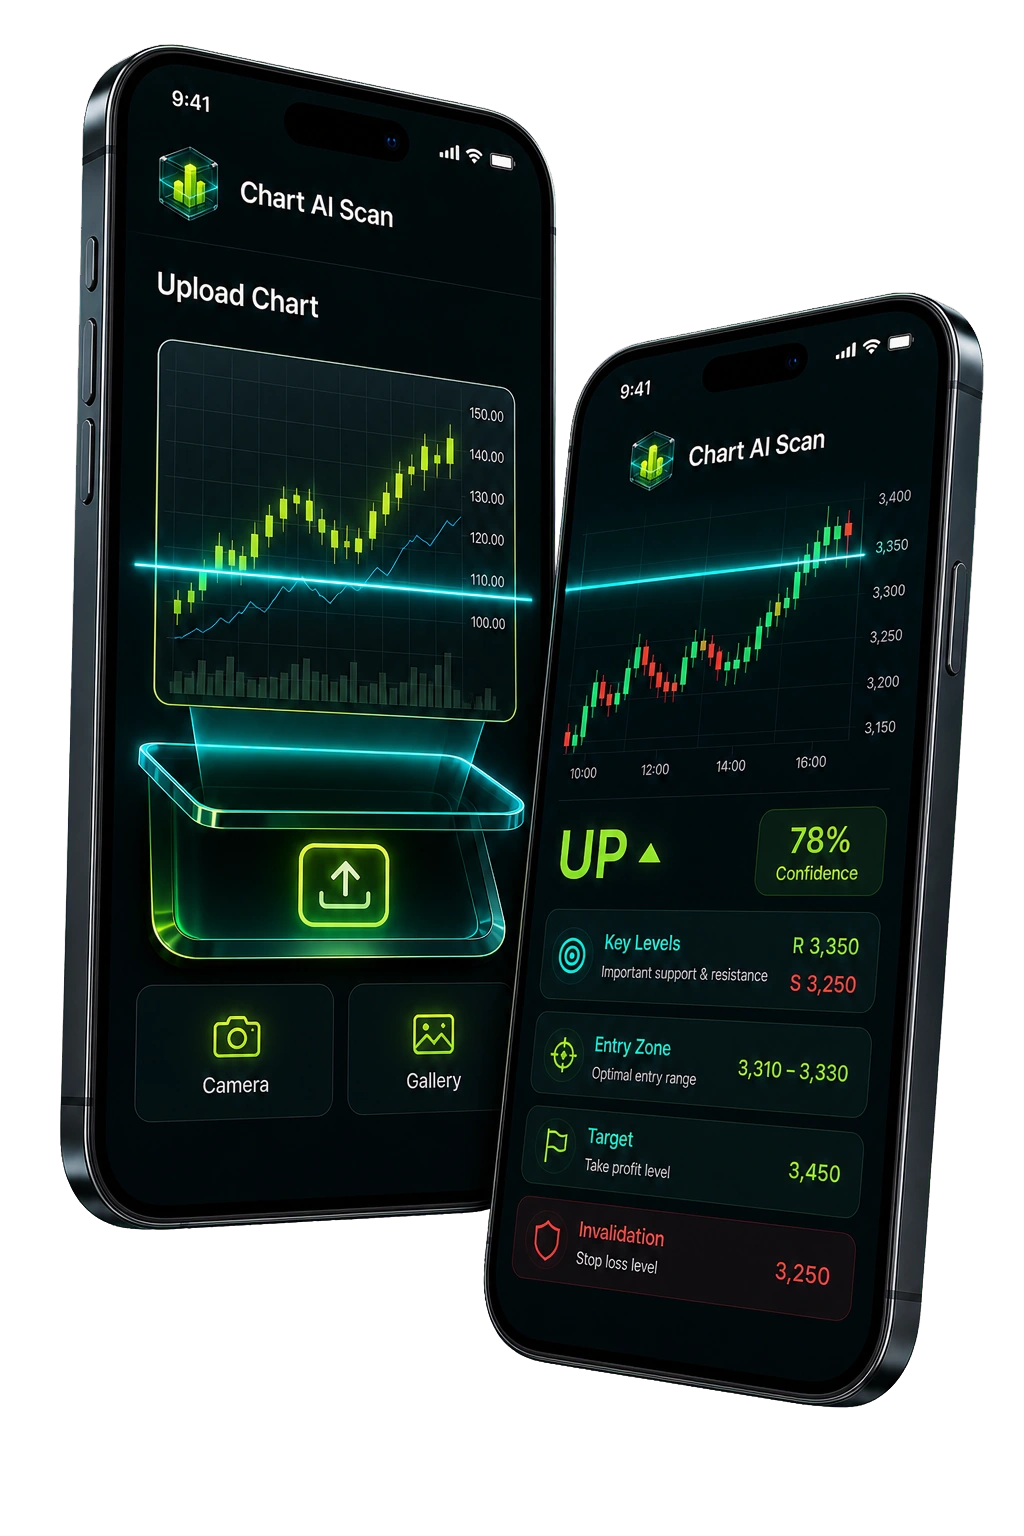
Stock analysis that works while you focus on trading.
Traditional stock analysis means hours in front of charts — drawing lines, measuring patterns, comparing levels. ChartAIScan's AI does all of this in seconds. Upload a chart for any stock — from mega-cap tech to small-cap movers — and the AI delivers a complete technical breakdown: patterns detected, trendlines drawn, support and resistance levels mapped, and candlestick formations identified. You get actionable intelligence without the grind.
AI analysis tailored for stock market dynamics.
Stocks behave differently from forex or crypto — they gap on earnings, react to sector news, and move with index-wide sentiment. ChartAIScan's AI is trained on millions of stock charts specifically, understanding stock-market-specific behaviours like earnings-driven gaps, pre-market moves, and sector correlations. The analysis you get is tuned for equity markets, not a generic one-size-fits-all model.
From blue chips to penny stocks — every symbol covered.
ChartAIScan analyses any stock chart regardless of market cap, sector, or exchange. AAPL, TSLA, and MSFT get the same depth of analysis as lesser-known names. The AI doesn't discriminate by liquidity or popularity — it reads the chart patterns, trendlines, and levels objectively for every symbol you upload.
Compare multiple stocks side by side.
Scanning one stock at a time limits your opportunity set. ChartAIScan lets you upload and analyse multiple stock charts in rapid succession, comparing pattern quality, trend strength, and key levels across your entire watchlist. Find the strongest setups across dozens of stocks in the time it would take to manually analyse two or three.
Common questions answered.
What does AI stock analysis do?
AI stock analysis automatically scans stock charts for technical patterns, draws trendlines, maps support and resistance levels, and identifies candlestick formations. ChartAIScan delivers a complete technical breakdown in seconds — the kind of analysis that would take a human 15-45 minutes per chart.
Can AI stock analysis replace a human analyst?
AI stock analysis augments rather than replaces human judgment. The AI excels at consistent, fatigue-free pattern detection and level mapping — tasks where humans are slow and error-prone. However, interpreting the AI's output within the context of market conditions, news, and strategy remains the trader's role.
Is ChartAIScan's stock analysis free?
ChartAIScan offers a free tier with full AI stock analysis capabilities — pattern detection, trendline analysis, and support/resistance mapping. No credit card is required. Premium plans unlock higher daily analysis limits and additional features.
Which stock exchanges does the AI support?
ChartAIScan works with charts from any stock exchange — NYSE, NASDAQ, LSE, TSE, ASX, and others. The AI analyses chart patterns regardless of the exchange the stock trades on. Simply upload a chart screenshot and the analysis runs the same way every time.
Does AI stock analysis work for swing trading and day trading?
Yes. ChartAIScan's AI works across all timeframes relevant to stock traders — intraday charts for day trading and daily/weekly charts for swing and position trading. The AI adapts its analysis to the timeframe of the chart you upload.