 CHARTAISCAN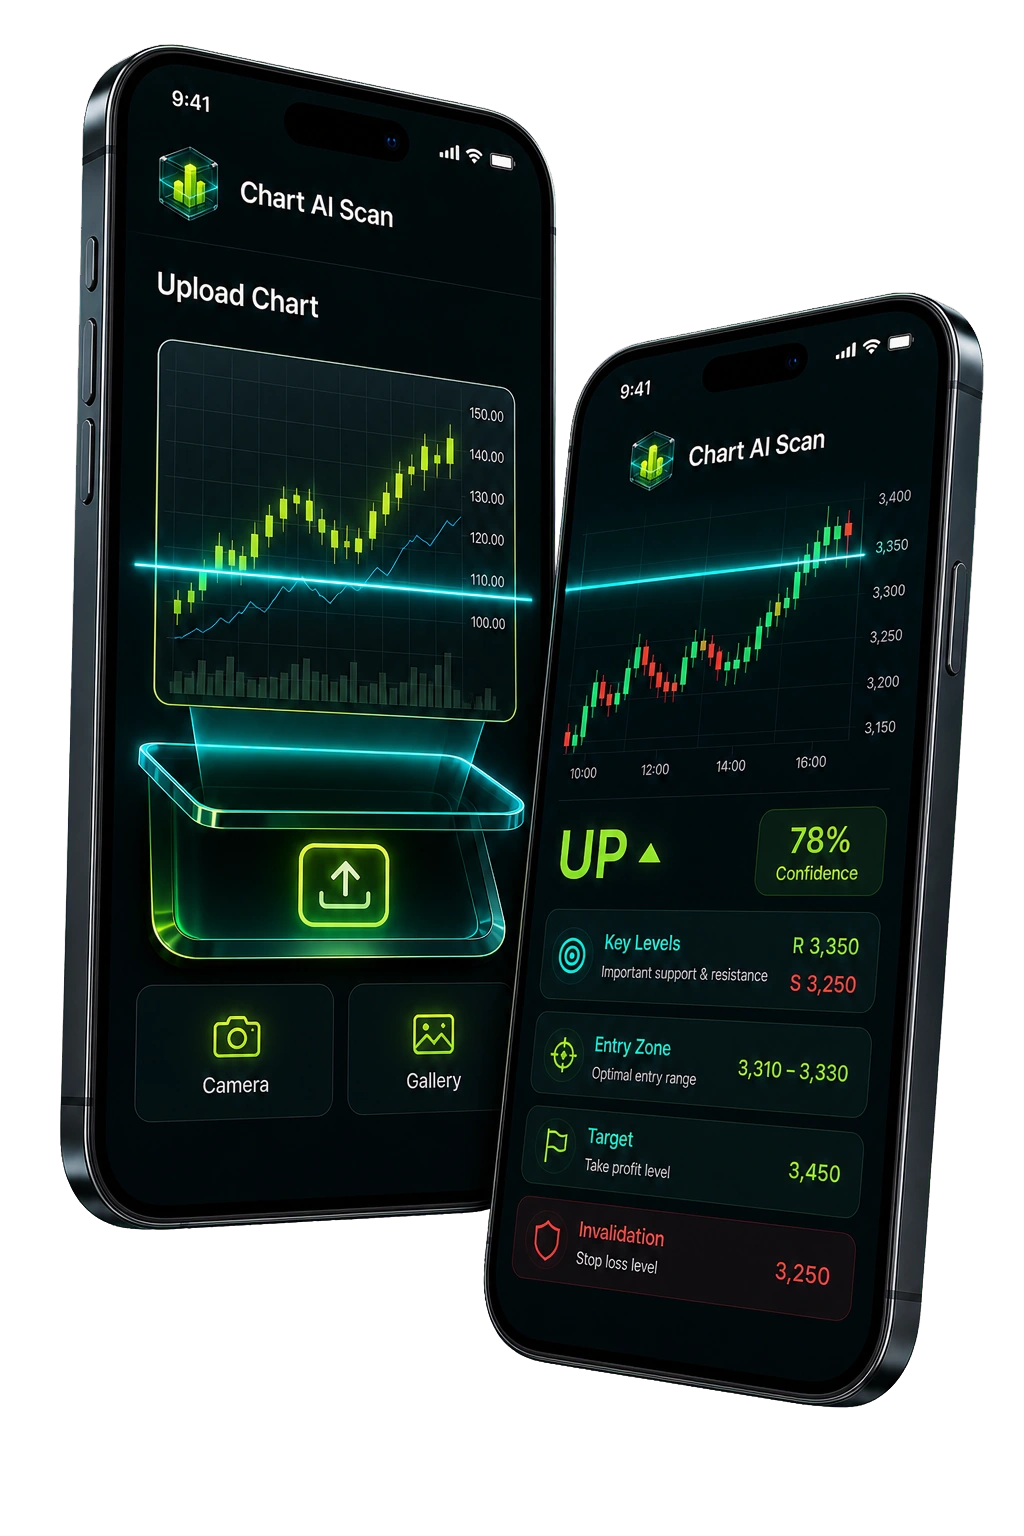
ChartAIScan's AI pattern scanner analyzes charts from any instrument — stocks, forex, or crypto. The AI detects 15+ chart patterns, draws trendlines, marks support/resistance zones, and provides confidence scores. Instant results, no manual charting required.
The patterns AI detects automatically.
Reversal patterns: double tops & bottoms, head and shoulders
Reversal patterns signal trend exhaustion. The AI identifies double tops/bottoms when price tests a level twice and fails, and head and shoulders when three peaks form with the middle highest. These patterns often precede significant directional moves with clear invalidation levels for risk management.
Continuation patterns: flags, triangles, and wedges
Continuation patterns signal that the existing trend is likely to resume after a brief consolidation. Bullish and bearish flags form after sharp moves followed by tight channels. Ascending and descending triangles show compression before breakout. The AI detects all variants across any timeframe.
Not every pattern is a trade
AI detection is a tool, not a guarantee. A pattern must be confirmed by volume, market context, and supporting indicators. ChartAIScan provides confidence scores so you can filter the strongest setups. Always apply your own risk management — no pattern works 100% of the time.
Candlestick formations: AI recognition
Beyond full chart patterns, the AI detects individual candlestick formations — engulfing patterns, dojis, hammers, shooting stars, morning/evening stars, and harami patterns. These provide micro-level timing signals that complement broader pattern analysis.
How AI pattern detection works.
What platforms integrate with.
AI analysis this week.
This week's market conditions favor reversal and continuation patterns. AI detection confidence is highest on daily and 4H timeframes. Watch for triangle breakouts and flag patterns forming across major instruments.
AI detection approach.
Multi-timeframe scanning
ChartAIScan analyzes patterns across multiple timeframes simultaneously. A flag on the 1H may be part of a larger triangle on the daily. The AI connects these structures to provide a complete picture of price action context.
Confidence scoring
Each pattern detection receives a confidence score based on pattern quality, historical reliability, volume confirmation, and market context. Filter by confidence to focus on the strongest setups with the highest probability of playing out.
How to use AI analysis
Use AI detection to confirm your thesis: buy breakouts from confirmed patterns with volume, use support/resistance levels for entries, and set stops at pattern invalidation points. The AI provides the analysis — you control the trade.
Pattern hierarchy by reliability.
Chart pattern scanner FAQ
What chart patterns can ChartAIScan detect? +
ChartAIScan detects 15+ chart patterns including double tops/bottoms, head and shoulders, bullish and bearish flags, ascending/descending triangles, wedges, channels, and candlestick formations. The AI also identifies trendlines and support/resistance zones automatically.
How accurate is AI pattern detection? +
ChartAIScan's AI is trained on millions of historical charts. Detection accuracy is highest on clean charts with sufficient data. Each detection includes a confidence score. The primary risk is low-quality charts — blurry screenshots or charts with too little price history reduce accuracy.
What is the best timeframe for pattern detection? +
Daily and 4H timeframes produce the highest confidence detections. Lower timeframes generate more patterns but with lower reliability. ChartAIScan's AI adapts to the timeframe and adjusts confidence scoring accordingly.
Can I scan multiple charts at once? +
Yes. The batch scanning feature (premium) lets you scan your entire watchlist simultaneously. Results are ranked by pattern confidence for quick prioritization. This is the most efficient way to screen for setups across multiple instruments.
What instruments does the scanner support? +
ChartAIScan works with stocks, forex pairs, and cryptocurrencies. The AI pattern recognition models are trained on universal price action — not limited to any single market.
Do I need to be a technical analysis expert? +
No. ChartAIScan automates pattern detection so you don't need to manually draw trendlines or identify patterns. The AI does the heavy lifting. Basic understanding of the detected patterns helps, but the platform is designed for traders at all experience levels.
Start scanning charts with AI.
AI-powered pattern detection with confidence scoring. Start free.