 CHARTAISCAN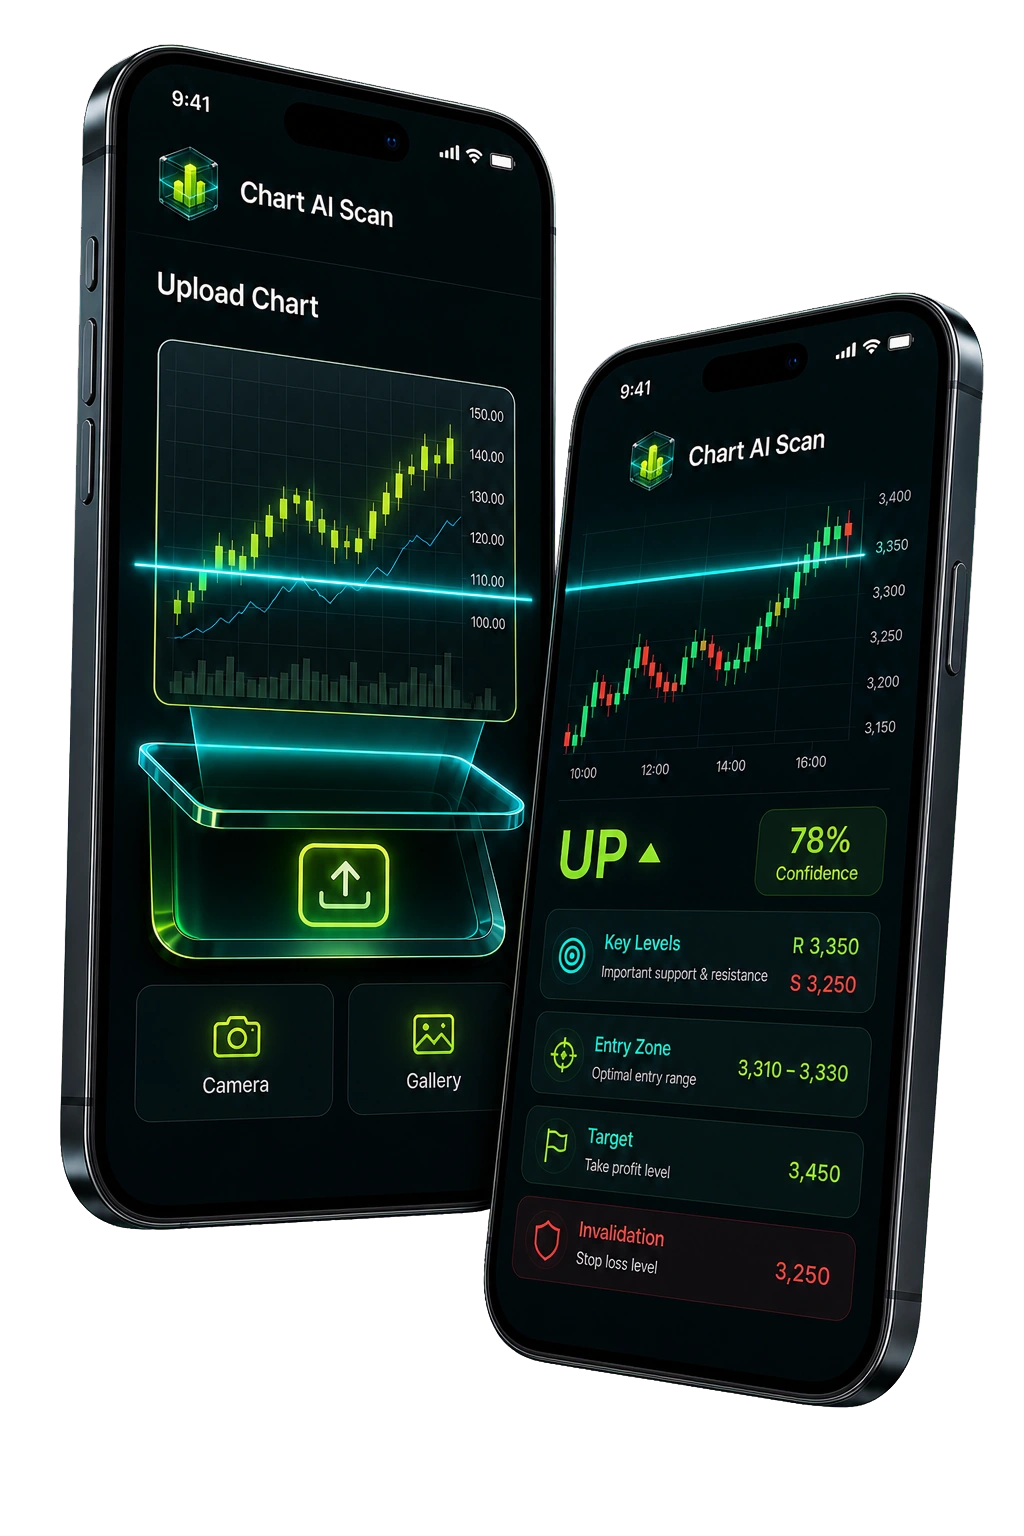
Market prices are primarily driven by US real yields, the US dollar, inflation expectations, central bank policy, geopolitical risk, and institutional fund flows. Of these, real yields — the nominal interest rate minus inflation — are the single most reliable and consistent driver over multi-month timeframes. ChartAIScan's AI analysis identifies key technical levels that help you navigate these macro drivers.
The 6 forces that move markets.
US Real Yields
Real yield = nominal interest rate minus inflation. Negative real yields (inflation > rates) are the most bullish condition for risk assets. Positive and rising real yields create headwinds. Watch: US 10-year TIPS yield on Bloomberg or TradingView.
US Dollar Strength
Global assets are priced in USD. A stronger dollar makes them more expensive internationally, reducing demand. A weaker dollar does the opposite. DXY (Dollar Index) has strong inverse correlations with commodities and emerging markets. This is the fastest-acting driver for intraday moves.
Central Bank Policy
The Fed, ECB, BOJ, and PBOC set monetary policy that ripples through all asset classes. Rate decisions, quantitative easing/tightening, and forward guidance shape the liquidity environment. Central bank communication is often more market-moving than actual policy changes.
Geopolitical Risk
War, sanctions, trade conflicts, and diplomatic crises trigger risk-off moves. Capital flows out of risk assets and into safe havens. These moves can be violent and fast. Geopolitical events that affect energy supply (Middle East, Russia) amplify the effect through oil-driven inflation fears.
Inflation Expectations
CPI, PPI, and PCE data releases move markets — but only when they deviate from consensus. A CPI print above consensus = rate hike fears = risk-off. A below-consensus CPI = rate cut hopes = risk-on. The Fed's reaction to inflation matters more than inflation itself.
Fund Flows & Positioning
ETF flows, mutual fund allocations, and institutional positioning drive sustained trends. Weekly fund flow data indicates institutional sentiment. COT (Commitment of Traders) reports show speculative positioning in futures. Extreme positioning in either direction is often a contrarian signal.
When drivers align or conflict.
Understanding each driver individually is only half the analysis. The most powerful (and trappable) market moves happen when multiple drivers align in the same direction — or when they conflict.
Falling real yields + weakening dollar + moderate inflation + no geopolitical threat + accommodative central banks + fund inflows. When 4 or more of these align, markets typically make sustained multi-week or multi-month moves higher. 2020 (COVID stimulus) and 2024 (rate cut anticipation) are examples.
Rising real yields + strengthening dollar + hot inflation + geopolitical risk + hawkish central banks + fund outflows. This constellation produces the sharpest corrections. The 2022 rate-hiking cycle was a near-perfect bearish alignment as the Fed raised rates at the fastest pace in 40 years.
Falling rates (bullish) + geopolitical fear (bearish) + weak dollar (bullish). When drivers conflict, markets oscillate in ranges and produce false breakouts. This is when reducing position size and waiting for resolution produces better results than trying to force a directional trade. AI analysis helps by identifying the key levels where ranges are likely to resolve.
Which events move markets most.
When markets are most active.
Volume and volatility concentrate in specific windows tied to the major financial centers. Run AI analysis during quiet sessions, then trade the setups when volume confirms the patterns.
Highest FX volatility. European institutions enter. Often sets the day's direction.
Most liquid period. Tightest spreads. Majority of daily volume clears here.
NYSE/NASDAQ open. Highest stock volume. Earnings released. Gap fills occur.
Lower volume. Asian market focus. Good for analysis and preparation.
Closing auction. Position squaring. Can see sharp end-of-day moves.
Weekend gap. Low volume. Best to wait for liquidity to return.
Market price movement FAQ
What is the single biggest driver of market prices? +
US real yields (nominal rates minus inflation). Negative real yields = bullish for risk assets. Rising real yields = bearish. The US 10-year TIPS yield is the benchmark. This relationship has held consistently for over 20 years across stocks, bonds, and commodities.
Why does the US dollar affect so many markets? +
Global commodities and many international assets are priced in USD. A stronger dollar makes them more expensive for international buyers, reducing demand. The inverse correlation between DXY and commodities is one of the most consistent in financial markets.
What events cause the biggest single-day moves? +
FOMC rate decisions and press conferences, Non-Farm Payrolls, US CPI, and major geopolitical events. For individual stocks, earnings surprises. The key is deviation from consensus expectation — not the absolute level of the data.
Do all markets move together? +
Not always. During risk-on environments, stocks, crypto, and commodities tend to rise together. During risk-off, correlations can break — safe havens rise while risk assets fall. In liquidity crises, everything can sell off simultaneously as investors raise cash.
Let AI read the markets for you.
ChartAIScan detects patterns, trendlines, and key levels automatically. Upload any chart and get instant analysis.